|
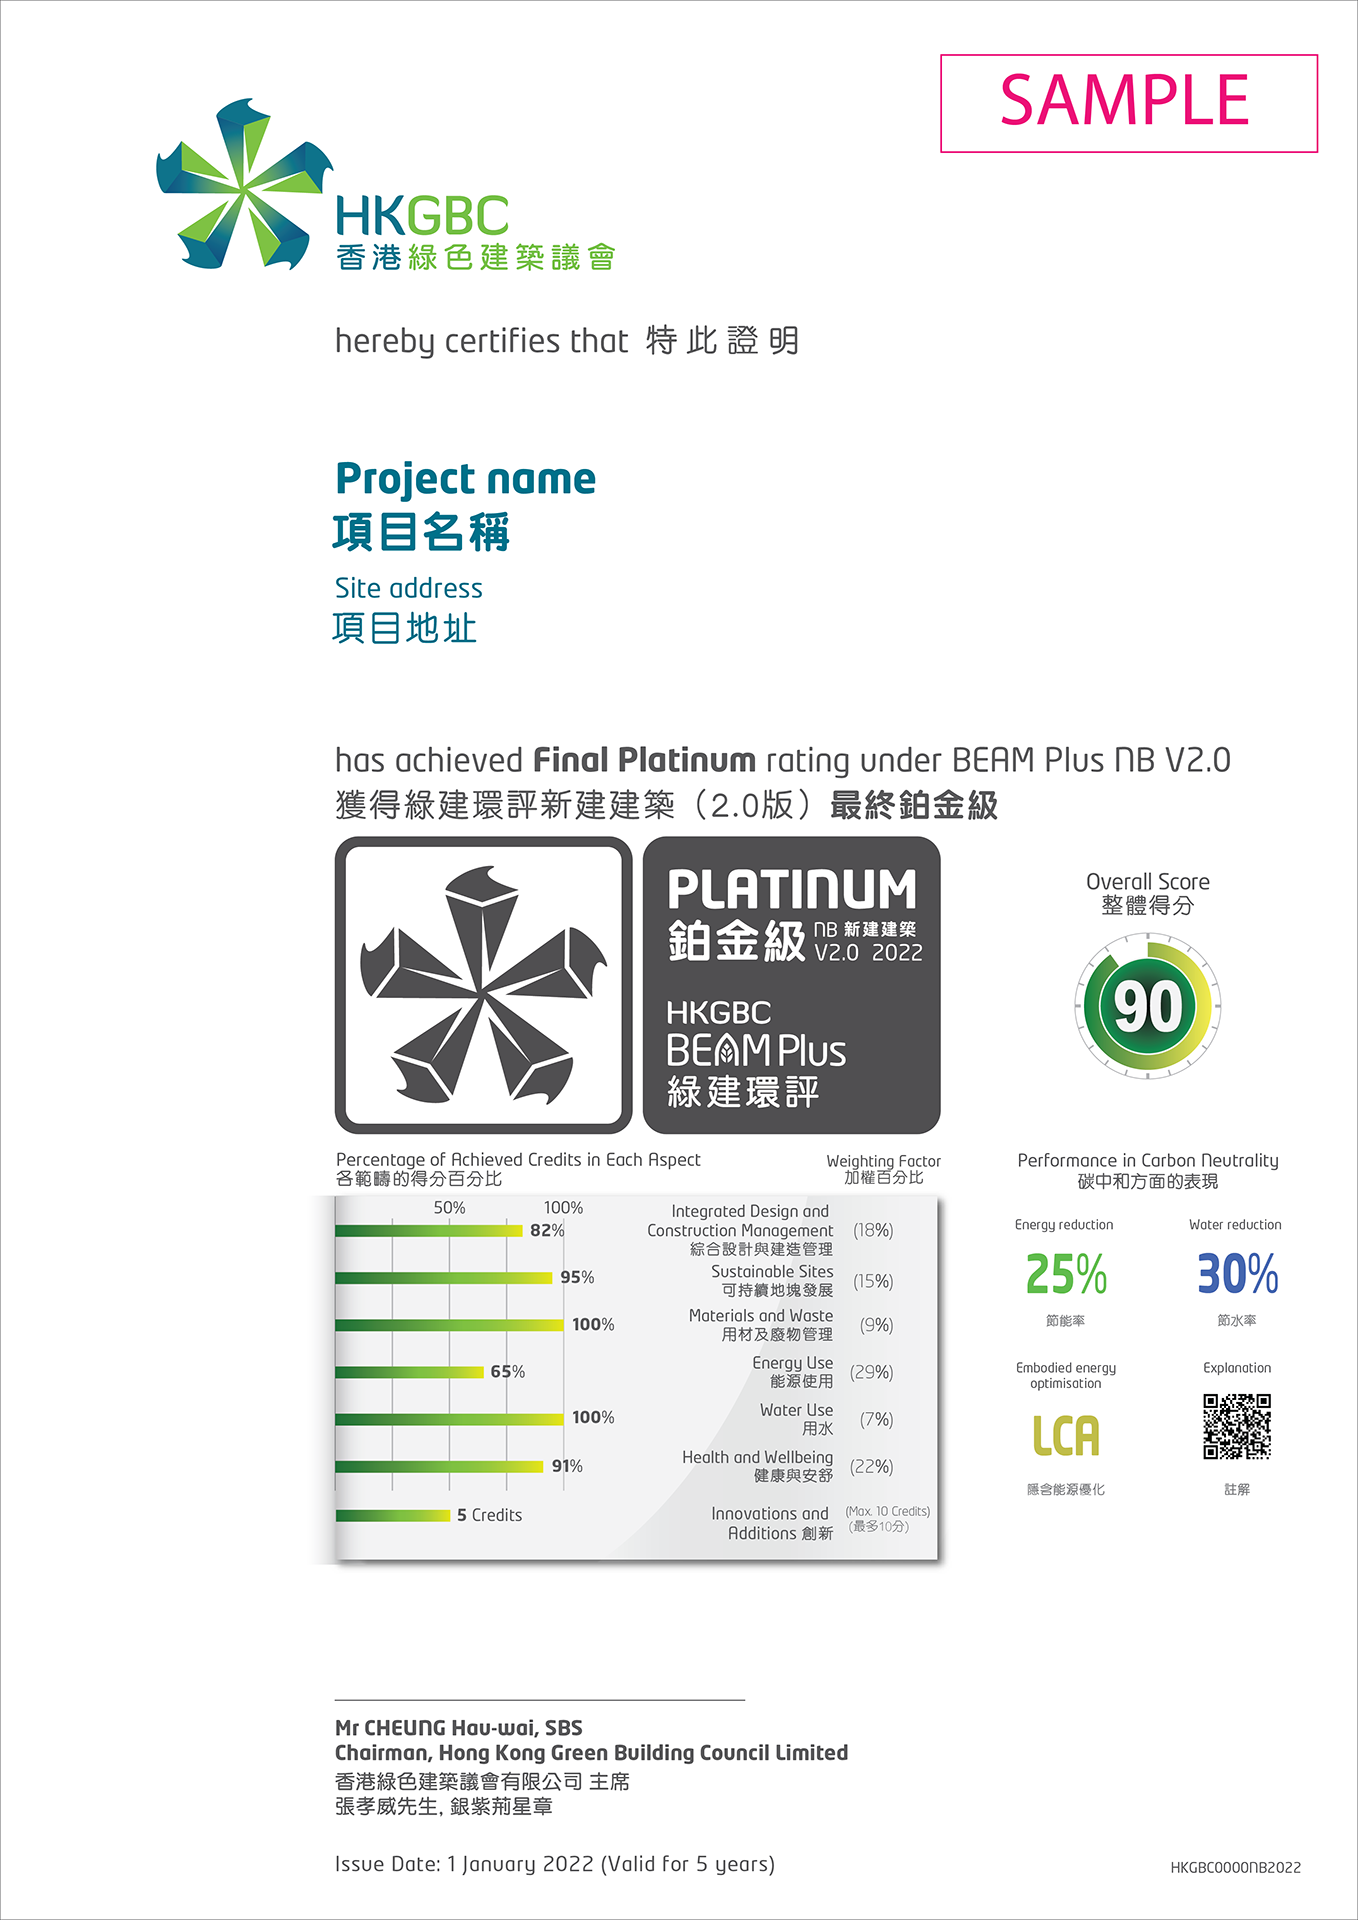
Sample Certificate and Explanation on |
 |
| Symbol examples | Meaning of symbol | Credit ref. no. | |
|---|---|---|---|
| Version 1.2 of NB Manual | Version 2.0 of NB Manual | ||
 |
The percentage of estimated annual energy use reduction as compared to the baseline (25% reduction in this example). For mixed-use development, the percentage is related to the building portion indicated next to the symbol. | EU1 | EU2 - Option 1 |
 |
This means that a prescriptive path (passive design) is used to achieve an energy-efficient design. Quantitative analysis of energy reduction is not available. | EU 1 - Option 2 | EU 2 - Option 2 |
 |
The percentage of estimated annual potable water use reduction as compared to the baseline (30% reduction in this example). | WU P2, WU 1 | WU P1, WU 1 |
 |
The embodied energy in major elements of building structure has been studied and optimised via Life Cycle Assessment (LCA). | EU 3 Bonus | MW 10 |
Note: If an indicator is not attained or pursued by a project, the concerned symbol will not appear on the certificate.
|
Sample Certificates and Explanation on |
.png) |
.png) |
| Symbol examples | Meaning of symbol | Credit ref. no. (EB V2.0) | |
|---|---|---|---|
| Comprehensive Scheme Manual | Selective Scheme Manual | ||
 |
Energy benchmarking result (percentile of subgroup of similar premises) using EMSD online benchmarking tool. In this example, the energy performance of the building is among the top 10th percentile of other similar premises. A lower figure means better performance. | EU 4a | EU 4a |
 |
Energy benchmarking result using HKGBC Benchmarking and Energy Saving Tool (HK BEST). In this example, the building has obtained a “Green” rating. Ratings from lowest to highest are: Green, Bronze, Silver, Gold, Platinum. | EU 4a | EU 4a |
 |
The percentage of estimated annual potable water use reduction as compared to the baseline (30% reduction in this example). | WU P2(Alt), WU 1 | Not applicable |
 |
Waste management plan has been implemented. | MWA 8a | MWA 8a |
| Symbol examples | Meaning of symbol | Credit ref. no. (EB V3.0) | |
|---|---|---|---|
| Comprehensive Scheme Manual | Theme Certification Manual | ||
|
Energy benchmarking result (percentile of subgroup of similar premises) using EMSD online benchmarking tool. In this example, the energy performance of the building is among the top 10th percentile of other similar premises. A lower figure means better performance. | EU-01-02c | EU-01-02c |
 |
The energy performance of the landlord's controlled area of the project achieves the benchmarking results obtained from Energy Star Portfolio Manager. The percentage indicates the reduction of project energy use intensity (EUI) compared with median weather normalised source EUI obtained from Energy Star Portfolio Manager. In this example, the EUI improvement is 30%. | EU-01-02b(Alt) | EU-01-02b(Alt) |
 |
The percentage of reduction in Annual Energy Utilisation Index compared with that of the past 5 years. In this example, the Energy Utilisation Index improves by 34%. | EU-01-02c | EU-01-02c |
 |
Have obtained a rating under Zero-Carbon-Ready Building Certification | EU-01-05 | EU-01-05 |
 |
Net percentage of fresh water consumption reduction in landlord-controlled area over the past 36 months. In this example, the fresh water consumption reduced by 9% compared with 3 years ago. | WU-04-02c | WU-04-02c |
|
Waste management plan has been implemented. | MW-03-04a | MW-03-04a |
 |
Annual waste reduction by weight for the past 12 months meeting the prescribed requirements. Baseline year can be any year in the past 36 months. In this example, the annual waste reduction by weight of the building reduced by 6% compared with basline year. | MW-03-05a | MW-03-05a |
Note: If an indicator is not attained or pursued by a project, the concerned symbol will not appear on the certificate.
|
Sample Certificate for Interiors |
.png) |
|
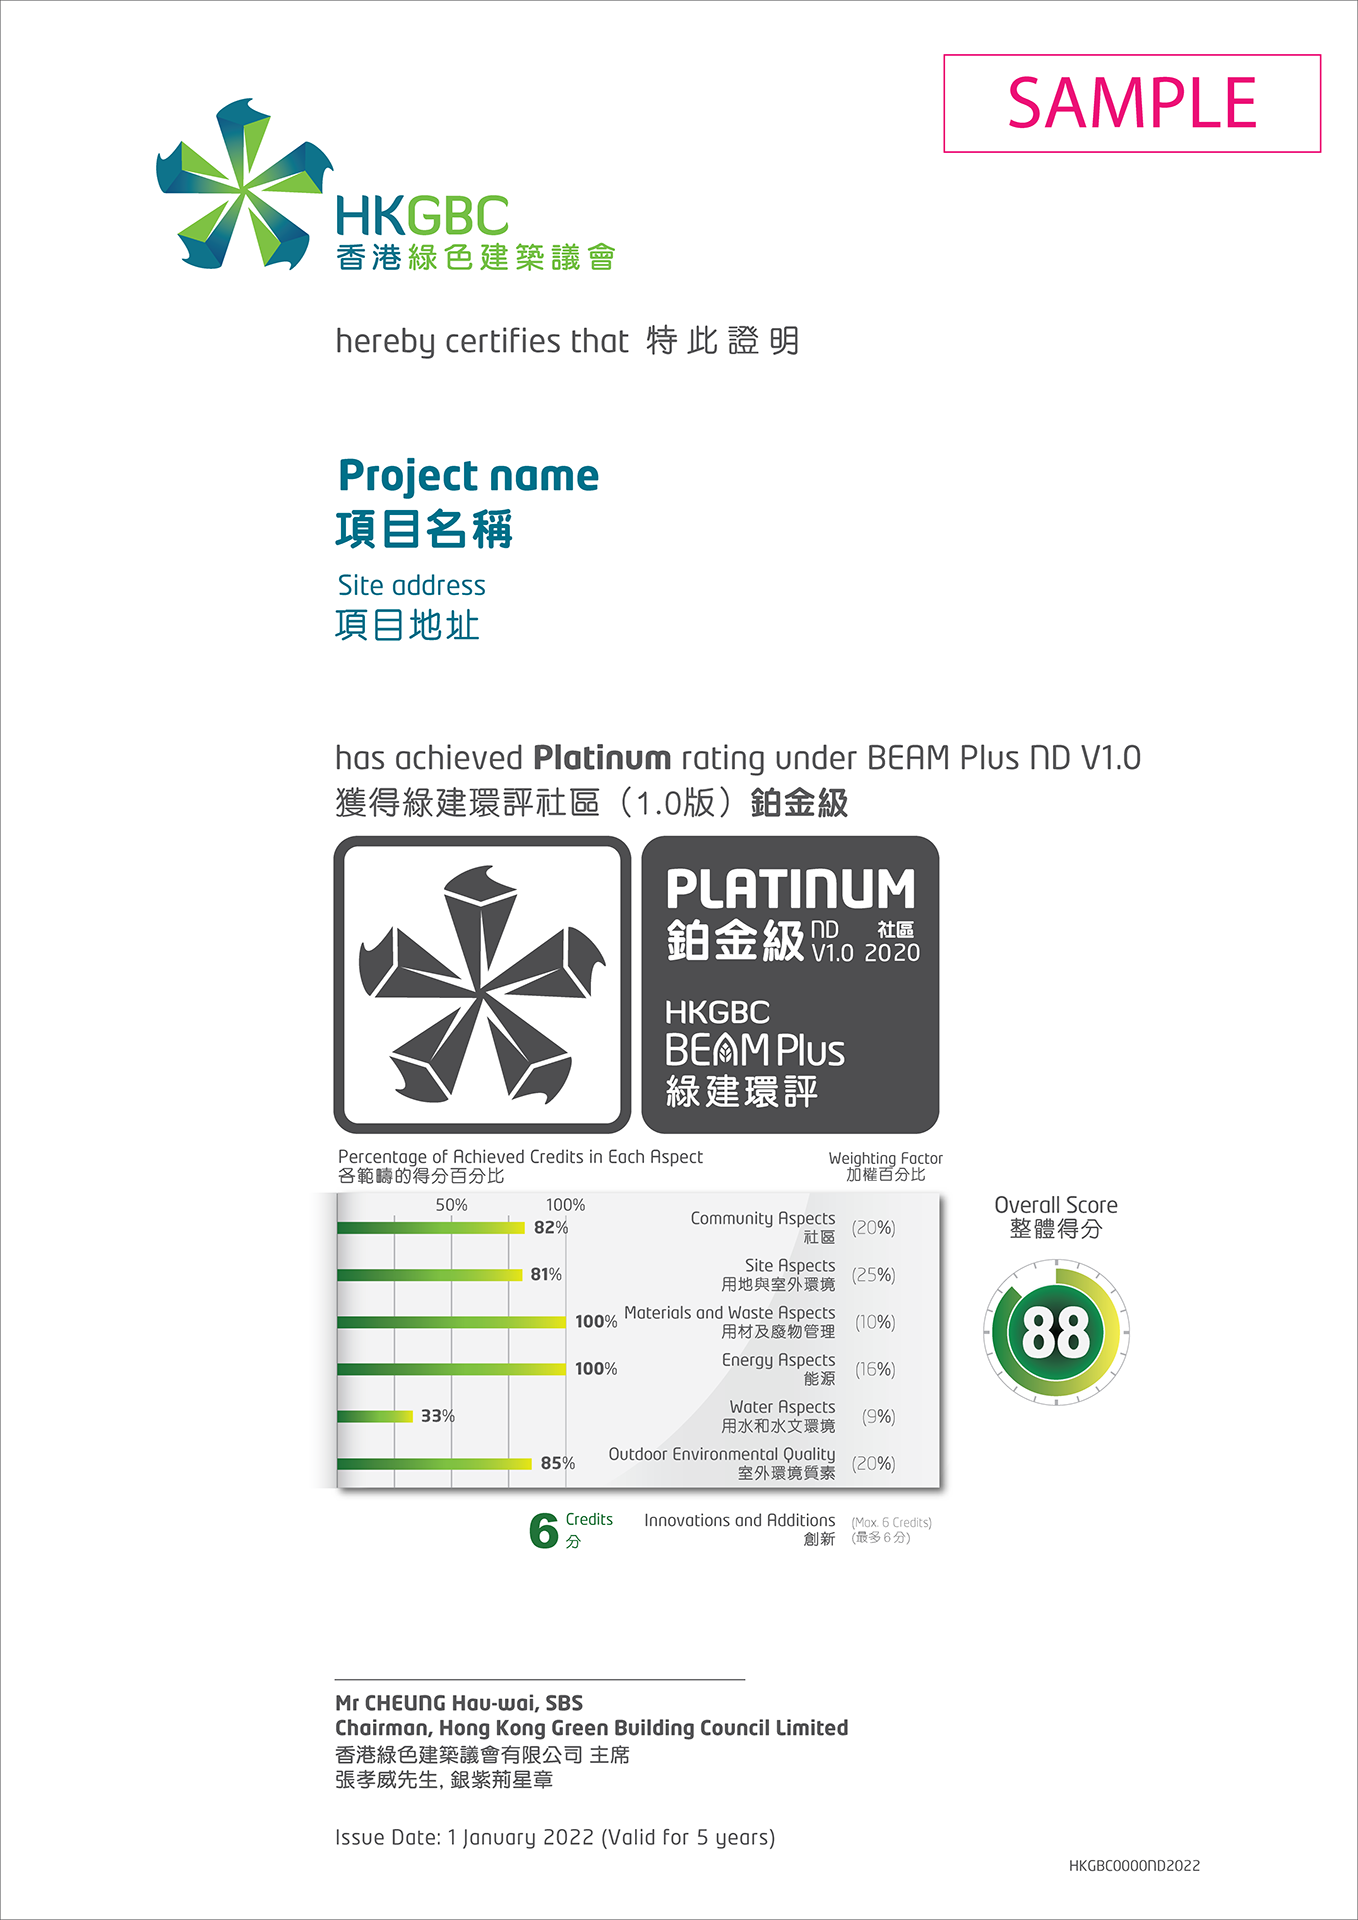
Sample Certificate for Neighbourhood |
 |
|
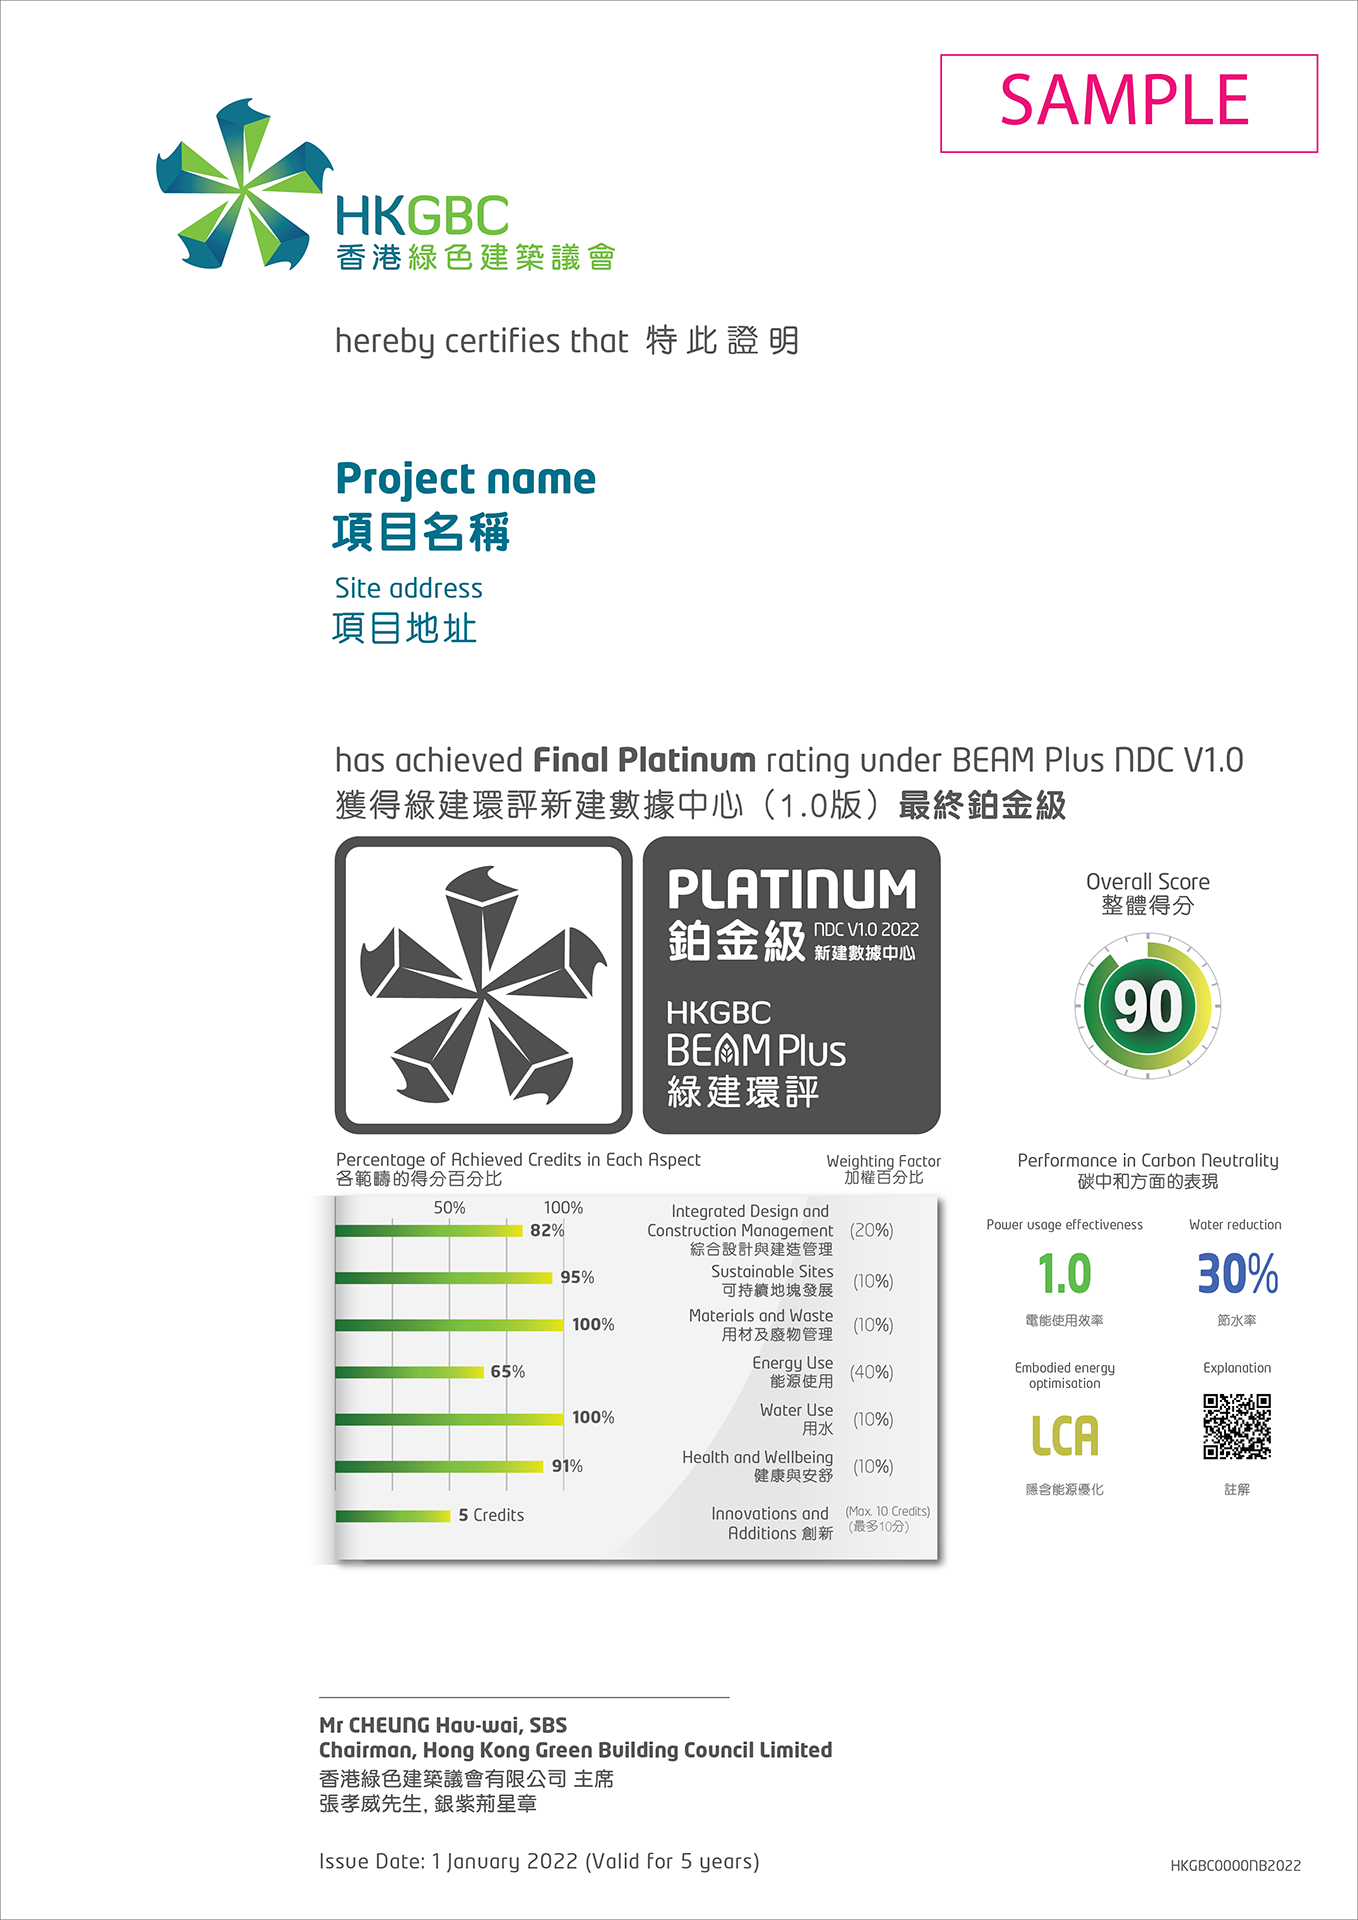
Sample Certificate and Explanation on |
 |
| Symbol examples | Meaning of symbol | Credit ref. no. |
|---|---|---|
.png) |
Predicted Power Usage Effectiveness (PUE), which is the ratio of the total amount of energy used by a data centre to the energy used by the computing equipment. The lower the figure, the better. Theoretical best value is 1.0. | EU-01-02 |
|
The percentage of estimated annual potable water use reduction as compared to the baseline (30% reduction in this example). | WU-01-01 |
|
The embodied energy in major elements of building structure has been studied and optimised via Life Cycle Assessment (LCA). | MW-02-06 |
Note: If an indicator is not attained or pursued by a project, the concerned symbol will not appear on the certificate.
|
Sample Certificate and Explanation on |
.png) |
| Symbol examples | Meaning of symbol | Credit ref. no. |
|---|---|---|
|
Operating Power Usage Effectiveness (PUE), which is the ratio of the total amount of energy used by a data centre to the energy used by the computing equipment. The lower the figure, the better. Theoretical best value is 1.0. | EU-05-01 |
|
The percentage of estimated annual potable water use reduction as compared to the baseline (30% reduction in this example). | WU-01-01 |
|
The building has a waste management plan. | MW-03-02a |
Note: If an indicator is not attained or pursued by a project, the concerned symbol will not appear on the certificate.
Content Online Date: ... [Clear Active Date] Content Offline Date: ... [Clear Inactive Date] Content Status: Display in Page Edit Mode only Display in Page Edit Mode, Staging & Production Workflow Status: The record is published to website(Online Date, Offline Date, Status) Back Update